
Page Speed Insights

Google’s free Page Speed Insights tool grades your site on speed, accessibility and SEO — but the score is the easy part. Here’s what it actually measures, why it moves rankings and revenue for Australian sites, and how to turn a red report into a prioritised action plan.

Type any URL into Google’s Page Speed Insights and you get a number between 0 and 100, colour-coded red to green. It’s the most-used performance tool on the web for a reason: it’s free, it’s Google’s own, and it turns a vague feeling that “the site is slow” into a concrete grade. The trap is treating that grade as the goal. The score is a summary; the value is in what sits underneath it — the real-user data that influences your rankings and the specific list of fixes that move it.
This guide covers what Page Speed Insights actually measures, why it matters for SEO and revenue, how to improve each metric, and — the part most articles skip — how to turn a messy report into a prioritised action plan your team can actually ship.
What is Page Speed Insights?
Page Speed Insights (PSI — and yes, Google officially writes it “PageSpeed Insights”, one word) is a free tool at pagespeed.web.dev that analyses a page and reports how fast and stable it is for real users, plus a set of opportunities to improve it. It scores four categories — Performance, Accessibility, Best Practices and SEO — for both mobile and desktop.
Under the hood, PSI combines two very different data sources, and understanding the split is the single most useful thing you can know about the tool:
- Field data (real users). Pulled from the Chrome User Experience Report (CrUX) — the actual Core Web Vitals experienced by Chrome visitors to your page over the trailing 28 days. This is the data Google uses for its page-experience ranking signal. It only appears if your page gets enough traffic.
- Lab data (a single test). A one-off Lighthouse run in a controlled environment — a simulated mid-range Android phone on throttled mobile data. This is what produces the 0–100 score and the “Opportunities” and “Diagnostics” you act on.
What Page Speed Insights measures
The four scores
Each category is scored 0–100. Performance is the one everyone fixates on, but the others matter for both users and search:
- Performance — how fast the page loads and becomes interactive. The headline number.
- Accessibility — whether the page works for users with assistive technology (alt text, contrast, labels, landmarks).
- Best Practices — security, console errors, deprecated APIs, image aspect ratios and similar hygiene.
- SEO — crawlability basics: a valid title and meta description, indexable content, legible font sizes, descriptive link text.
Core Web Vitals — the metrics that count for ranking
The Performance score is built from a handful of metrics, but three of them are special: the Core Web Vitals. These are the user-experience measurements Google standardised across the web, and they’re the ones tied to the page-experience ranking signal. Each has a clear threshold:
| Metric | What it measures | Good | Poor |
|---|---|---|---|
| LCP — Largest Contentful Paint | How long until the main content (usually the hero image or heading) is visible | ≤ 2.5 s | > 4.0 s |
| INP — Interaction to Next Paint | How quickly the page responds when a user taps, clicks or types (replaced FID in 2024) | ≤ 200 ms | > 500 ms |
| CLS — Cumulative Layout Shift | How much the layout jumps around as it loads (the 0.0–1.0 “jank” score) | ≤ 0.10 | > 0.25 |
The supporting lab metrics
Inside the Lighthouse score you’ll also see First Contentful Paint (when the first text or image appears), Total Blocking Time (a lab proxy for INP — how long the main thread is frozen by JavaScript), and Speed Index (how quickly the page visually fills in). Total Blocking Time and LCP carry the most weight in the score, so heavy JavaScript and a slow hero image are usually what drags the number down.
Why Page Speed Insights matters
It’s tempting to dismiss the score as a developer vanity metric. Three reasons not to:
1. It’s a Google ranking signal. Core Web Vitals feed the page-experience signal. It’s rarely the thing that vaults you from page two to page one on its own — relevance and links still lead — but it acts as a tiebreaker between comparable pages, and the effect is sharper on competitive, commercial queries where everyone’s content is already good.
2. Speed is conversion. This is the bigger, more reliable payoff. Google’s own research found that as mobile page load time goes from one second to three, the probability of a bounce rises sharply — and every Australian retailer that has run the numbers heading into a Click Frenzy or end-of-financial-year sale sees the same curve: a faster page books more demos, sells more carts and wastes less of the ad spend pushing traffic to it. Shaving a slow 4-second LCP down to 2 seconds on a product page is often worth more than any single ranking move.
3. Mobile-first means the mobile score is the real score. Google indexes the mobile version of your site, and PSI tests mobile on a throttled mid-range device. A site that scores 95 on desktop and 38 on mobile is, as far as Google and most of your users are concerned, a 38.
“Don’t optimise for the score. Optimise for the slowest real experience your customers actually have — the score follows.”
How to improve your Page Speed Insights score
Almost every performance problem traces back to one of the three Core Web Vitals. Fix them in that frame and the score takes care of itself.
Fix LCP (slow main content)
- Serve the hero image in a modern format (WebP/AVIF), correctly sized, and mark it
priority/ preloaded so it isn’t lazy-loaded. - Eliminate render-blocking CSS and JavaScript — inline the critical CSS and defer the rest.
- Cut Time to First Byte: cache HTML at a CDN edge (ideally with Australian nodes), and don’t make the hero element wait on client-side JavaScript to render.
Fix INP / Total Blocking Time (sluggish interactions)
- Ship less JavaScript. Code-split, remove unused libraries, and defer or lazy-load anything not needed for the first interaction.
- Delay non-essential third parties — chat widgets, A/B tools, heavier analytics — until the user interacts or the page is idle.
- Break up long tasks so the main thread isn’t frozen when someone taps.
Fix CLS (layout jumping around)
- Set explicit
widthandheight(or an aspect-ratio box) on every image, video and embed. - Reserve space for anything injected after load — ad slots, banners, cookie bars, chat launchers.
- Use
font-display: swapand preload key fonts so text doesn’t reflow when the web font lands.
How to build a Page Speed Insights action plan
A red report is overwhelming because PSI lists everything at once. Turn it into a plan in five steps:
- Start with field data, not the score. Open the Core Web Vitals section. Which of LCP, INP or CLS is failing for real users on mobile? That’s your headline problem. If there’s no field data yet, fall back to the lab Core Web Vitals.
- Map each opportunity to a vital. Tag every Lighthouse opportunity to the metric it helps (e.g. “defer unused JS” → INP; “properly size images” → LCP + CLS). Now the list has structure.
- Score impact vs effort. Plot fixes on a simple grid. Quick wins (high impact, low effort) — image compression, deferring a chat widget, setting image dimensions — go first. Big projects (re-architecting the JavaScript bundle, CDN caching) get planned and resourced.
- Fix by template, not by page. On a real site, the same hero component or script is on hundreds of URLs. Fixing it once at the template level fixes the whole site — far better ROI than chasing one URL’s score.
- Re-measure on a cadence. Field data is a 28-day rolling window, so a fix takes weeks to fully surface. Re-run after each release and review the field trend monthly. Track movement against a baseline rather than a single snapshot.
From score to strategy
Page Speed Insights is a brilliant diagnostic and a poor scoreboard. Run it, read the field data first, group the fixes by Core Web Vital, and ship the template-level changes that move the metrics your customers feel. The number will climb on its own.
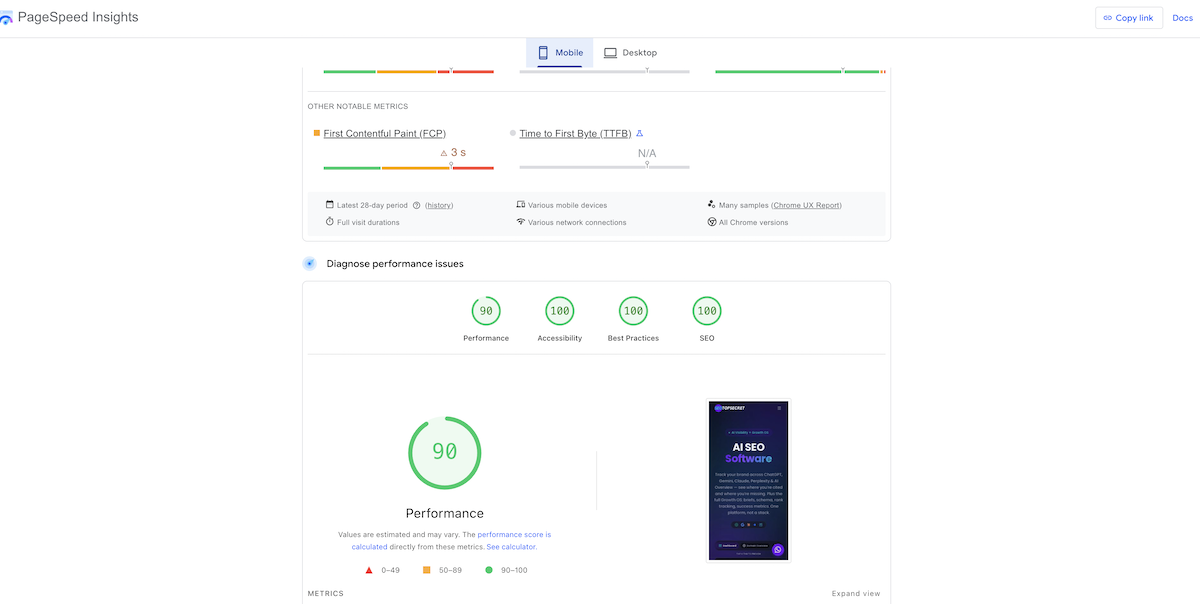
We hold our own site to the same bar. A recent mobile Page Speed Insights run for seotopsecret.com came back 90 / 100 / 100 / 100 — Performance, Accessibility, Best Practices and SEO — built on the exact playbook above: a static, instantly-painting hero (fast LCP), third-party scripts deferred off the critical path (low blocking time), and reserved space for every image (near-zero layout shift).
If you’d rather not run PSI URL by URL forever, that’s exactly where a growth platform earns its keep. SEOTopSecret’s technical SEO audit crawls your whole site and flags Core Web Vitals, indexation and the rest in one pass, and success metrics track the movement over time so a one-off score becomes a managed trend. See how it fits on the pricing page.
Frequently asked questions
What is a good Page Speed Insights score?+
90–100 is good (green), 50–89 needs improvement (orange), and 0–49 is poor (red). But the score is a weighted summary of lab metrics — the number that actually affects Google rankings is your field data (real-user Core Web Vitals), shown separately at the top of the report. Aim to pass Core Web Vitals first, then chase the score.
What’s the difference between lab data and field data in PSI?+
Field data is the Chrome User Experience Report (CrUX) — Core Web Vitals collected from real Chrome users over the trailing 28 days. Lab data is a single Lighthouse test in a controlled environment (a simulated mid-range phone on throttled mobile data). Google uses field data for its page-experience ranking signal; lab data is for diagnosing why, because it lists specific opportunities. If they disagree, trust the field data and use the lab diagnostics to fix it.
Does page speed actually affect SEO and rankings?+
Yes, but in proportion. Core Web Vitals are part of Google’s page-experience signals — a real ranking input that most often acts as a tiebreaker between pages with similar relevance, and matters more on competitive, high-intent queries. The bigger, more reliable wins are downstream: faster pages convert better, bounce less, and get crawled more efficiently.
Why is my .com.au site slow even though the code looks fine?+
For Australian sites it’s often the server location, not the code. If your origin sits in a US or European data centre, the network round trip to Sydney, Melbourne or Perth alone can blow out your Time to First Byte before any content loads. A CDN with Australian edge nodes caching the page close to your users is frequently the single biggest Core Web Vitals win for a .com.au site.
Why is my mobile score so much lower than desktop?+
PSI tests mobile on a simulated mid-range device with throttled mobile data, which is far harsher than a laptop on office wi-fi. Heavy JavaScript, large images and third-party scripts hurt mobile disproportionately. Since Google indexes mobile-first, the mobile report is the one that counts — fix that one.
Follow SEOTopSecret on LinkedIn
Weekly posts on AI SEO, GEO and growth operating systems. No fluff.
Set SEOTopSecret as a preferred source
See more of our coverage in Top Stories on Google.
Keep reading

Why I built SEOTopSecret
After 25 years leading senior SEO for 100+ brands across four continents, the lesson stayed the same: the bottleneck was never the work — it was encoding how a senior consultant thinks so that thinking could run 24/7.

SEO conferences 2026
The curated guide to the global and regional SEO 2026 conferences worth attending — with an APAC and Australian lens, plus an ROI framework for each event.

Coworking near me
Searching coworking near me usually means a meeting tomorrow, a hybrid team that needs a base, or a founder tired of working from the kitchen bench — three different problems with three different answers. This guide ranks verified spaces in every Australian state and territory.